Steve Franklin: What does good look like in quarrying?
Eltirus founder Steve Franklin discusses performance: how to improve it and, importantly, how to measure it.
We hear a lot of talk about the need to innovate, to implement AI solutions and bigger and better equipment and I am certainly amongst those who do, but a recent site visit prompted me to reflect (and pass on) a different approach to getting more out of your operation.
Theoretical performance
If you want to get the best out of any system, the first thing to do is to determine what the system is capable of and then compare that to what the system is actually doing, in essence, a gap analysis of theoretical vs actual.
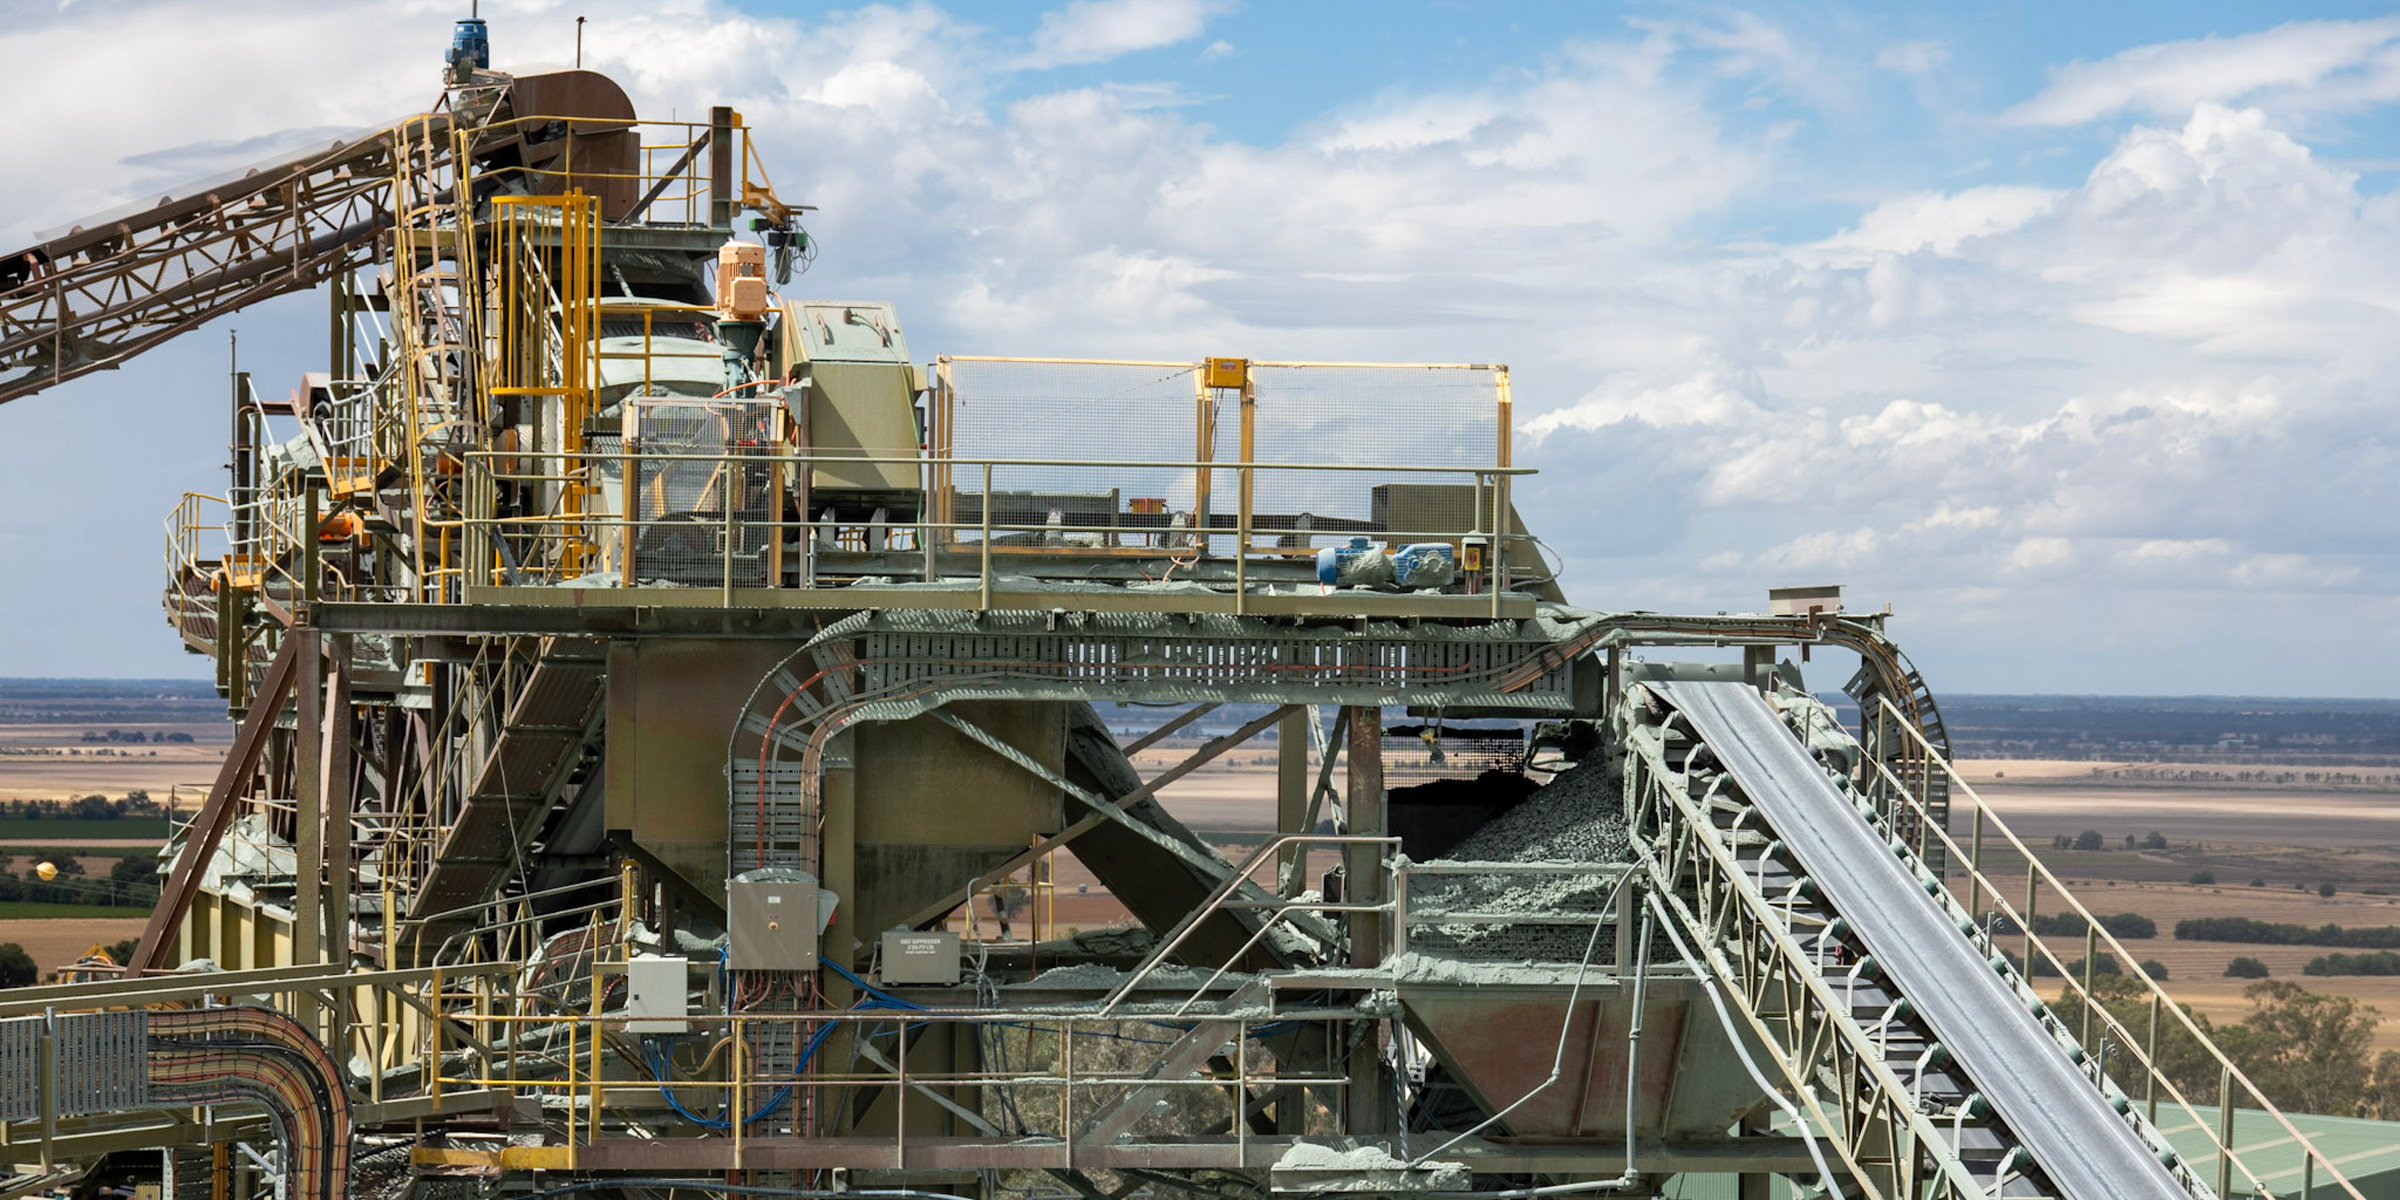
If we are considering a fixed plant setup, that analysis of system capability probably comes from say performing an AggFlow analysis of the plant and calibrating it with belt cuts.
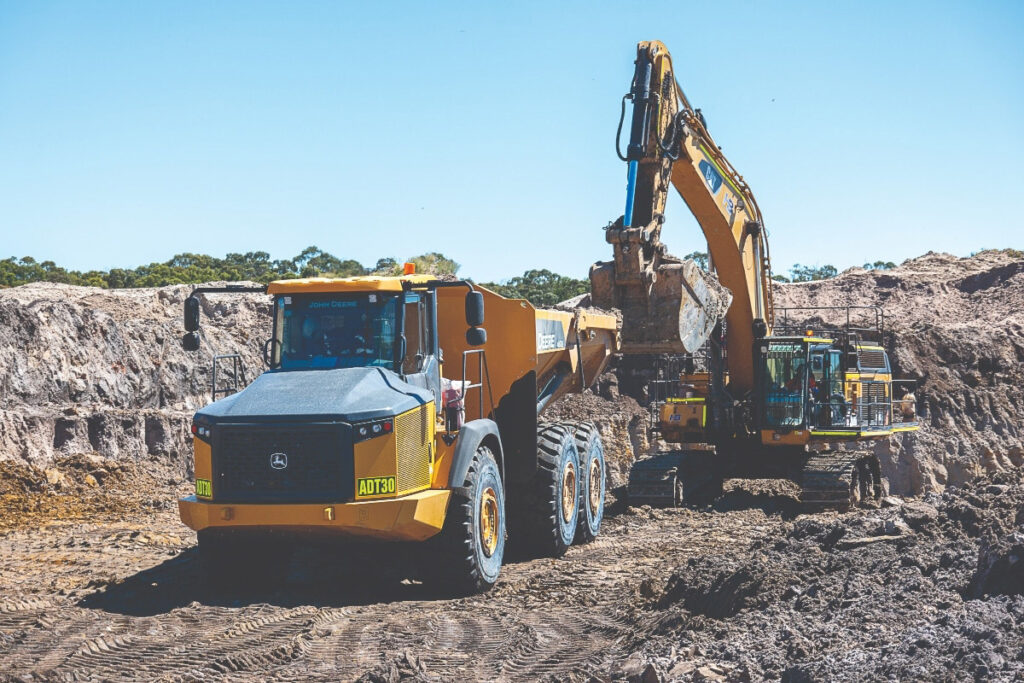
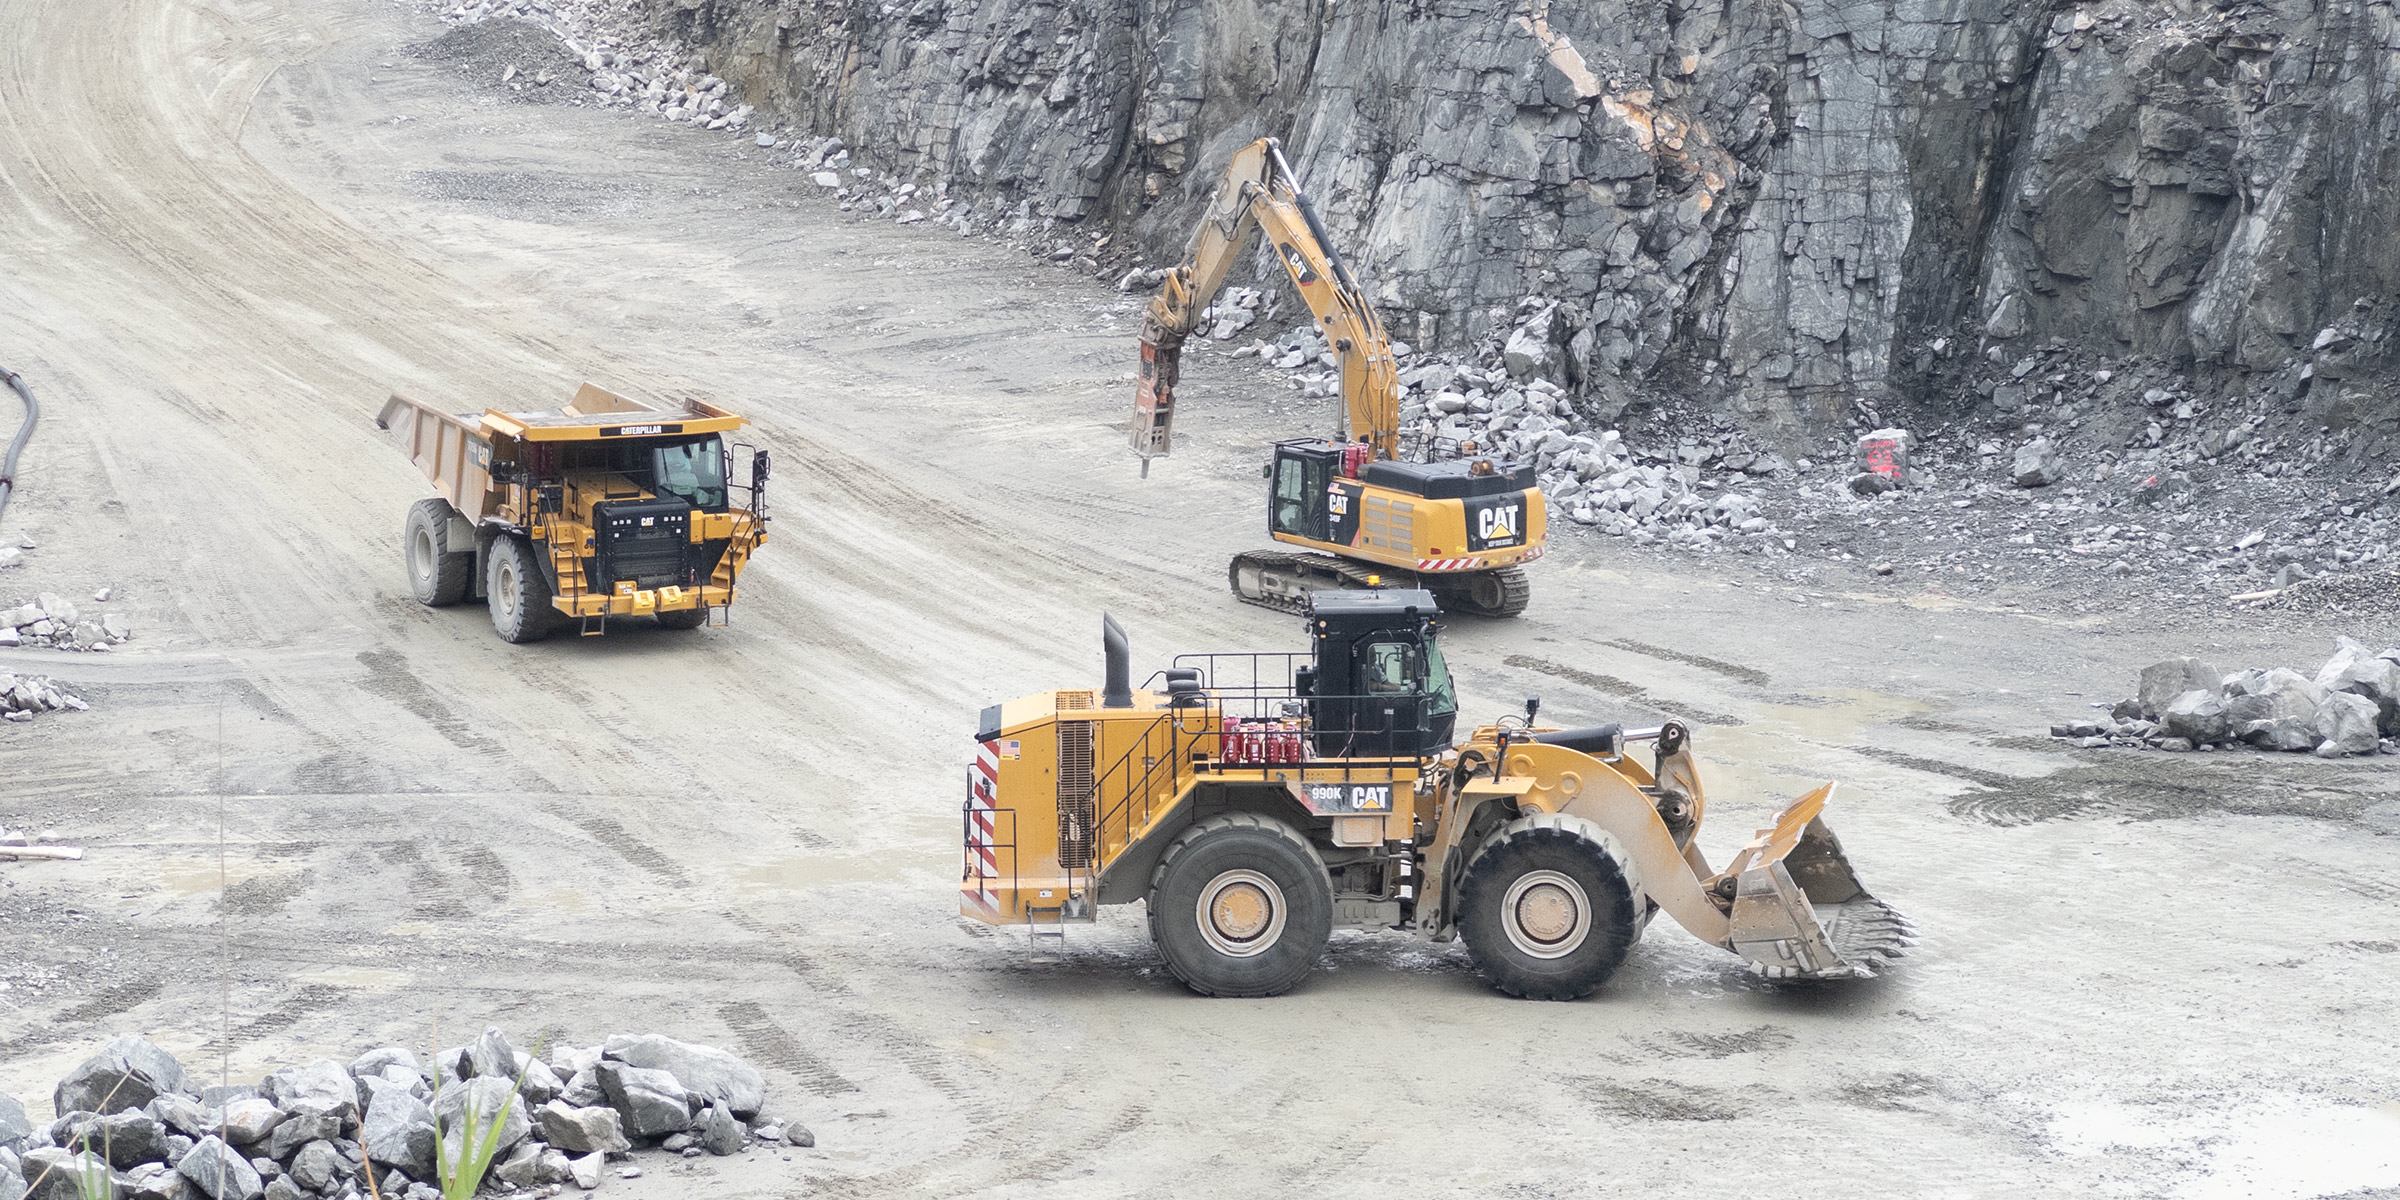
To determine mobile fleet performance, software like Talpac can be used to model loading tool and hauling performance. Image: Eltirus
If we were looking at mobile fleet performance, maybe you might use software like Talpac to model loading tool and hauling performance and work out fixed plant and hauler match, hauler numbers etc.
This is the point where you should be asking yourself “what does good looks like?” By way of example, what would a good cycle time be for a Cat 990K loading 775G haul trucks with well shot basalt? How would you find this out?
Getting a good understanding of theoretical performance gives us the starting point for further analysis.
There are some great benchmarking documents that help to answer just these types of questions – if you need one, please contact me.
Note that I am making no mention here of AI, machine learning and the like. I am talking from the point of view of having a comprehensive understanding of a system, the ability to observe actual performance and determine how to narrow the gap. As systems become very complicated, AI and the like do have application, particularly in terms of logistics planning, but that is not the subject of this article.
Actual performance
Mapping actual performance can be an interesting exercise as you need to ensure that you have enough data to make sure that you really do know what actual performance looks like.
By way of example – back before we had systems on mobile equipment that track every load and haul cycle, I had performed a productivity survey on a site. The results were appalling – as bad as I had seen anywhere and I took this as the baseline productivity for the site analysis.
When I did my gap analysis and proposed a solution I found that had my baseline wrong. What I had assumed as an (awful) average performance was actually the team putting on a show for me and in reality their baseline performance was some 30 per cent worse than I thought it could possibly be.
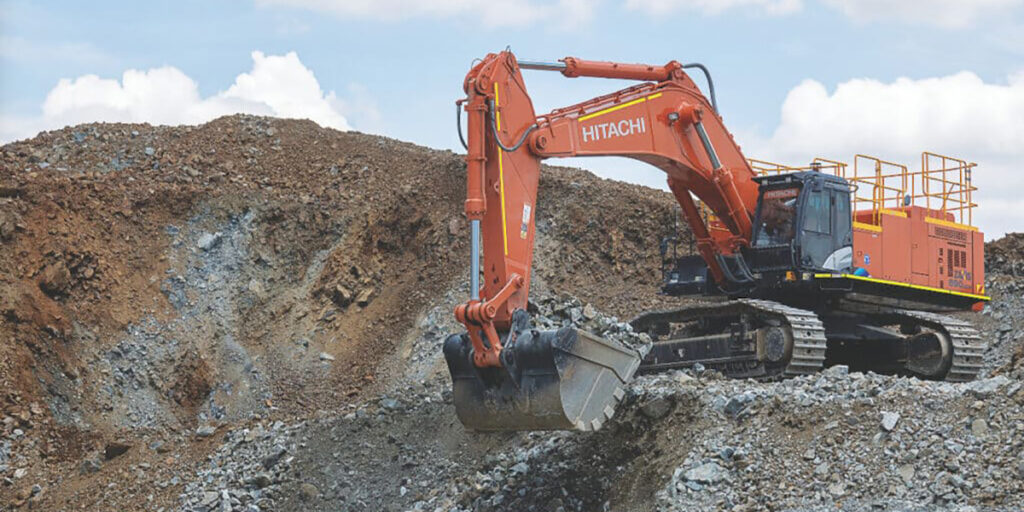
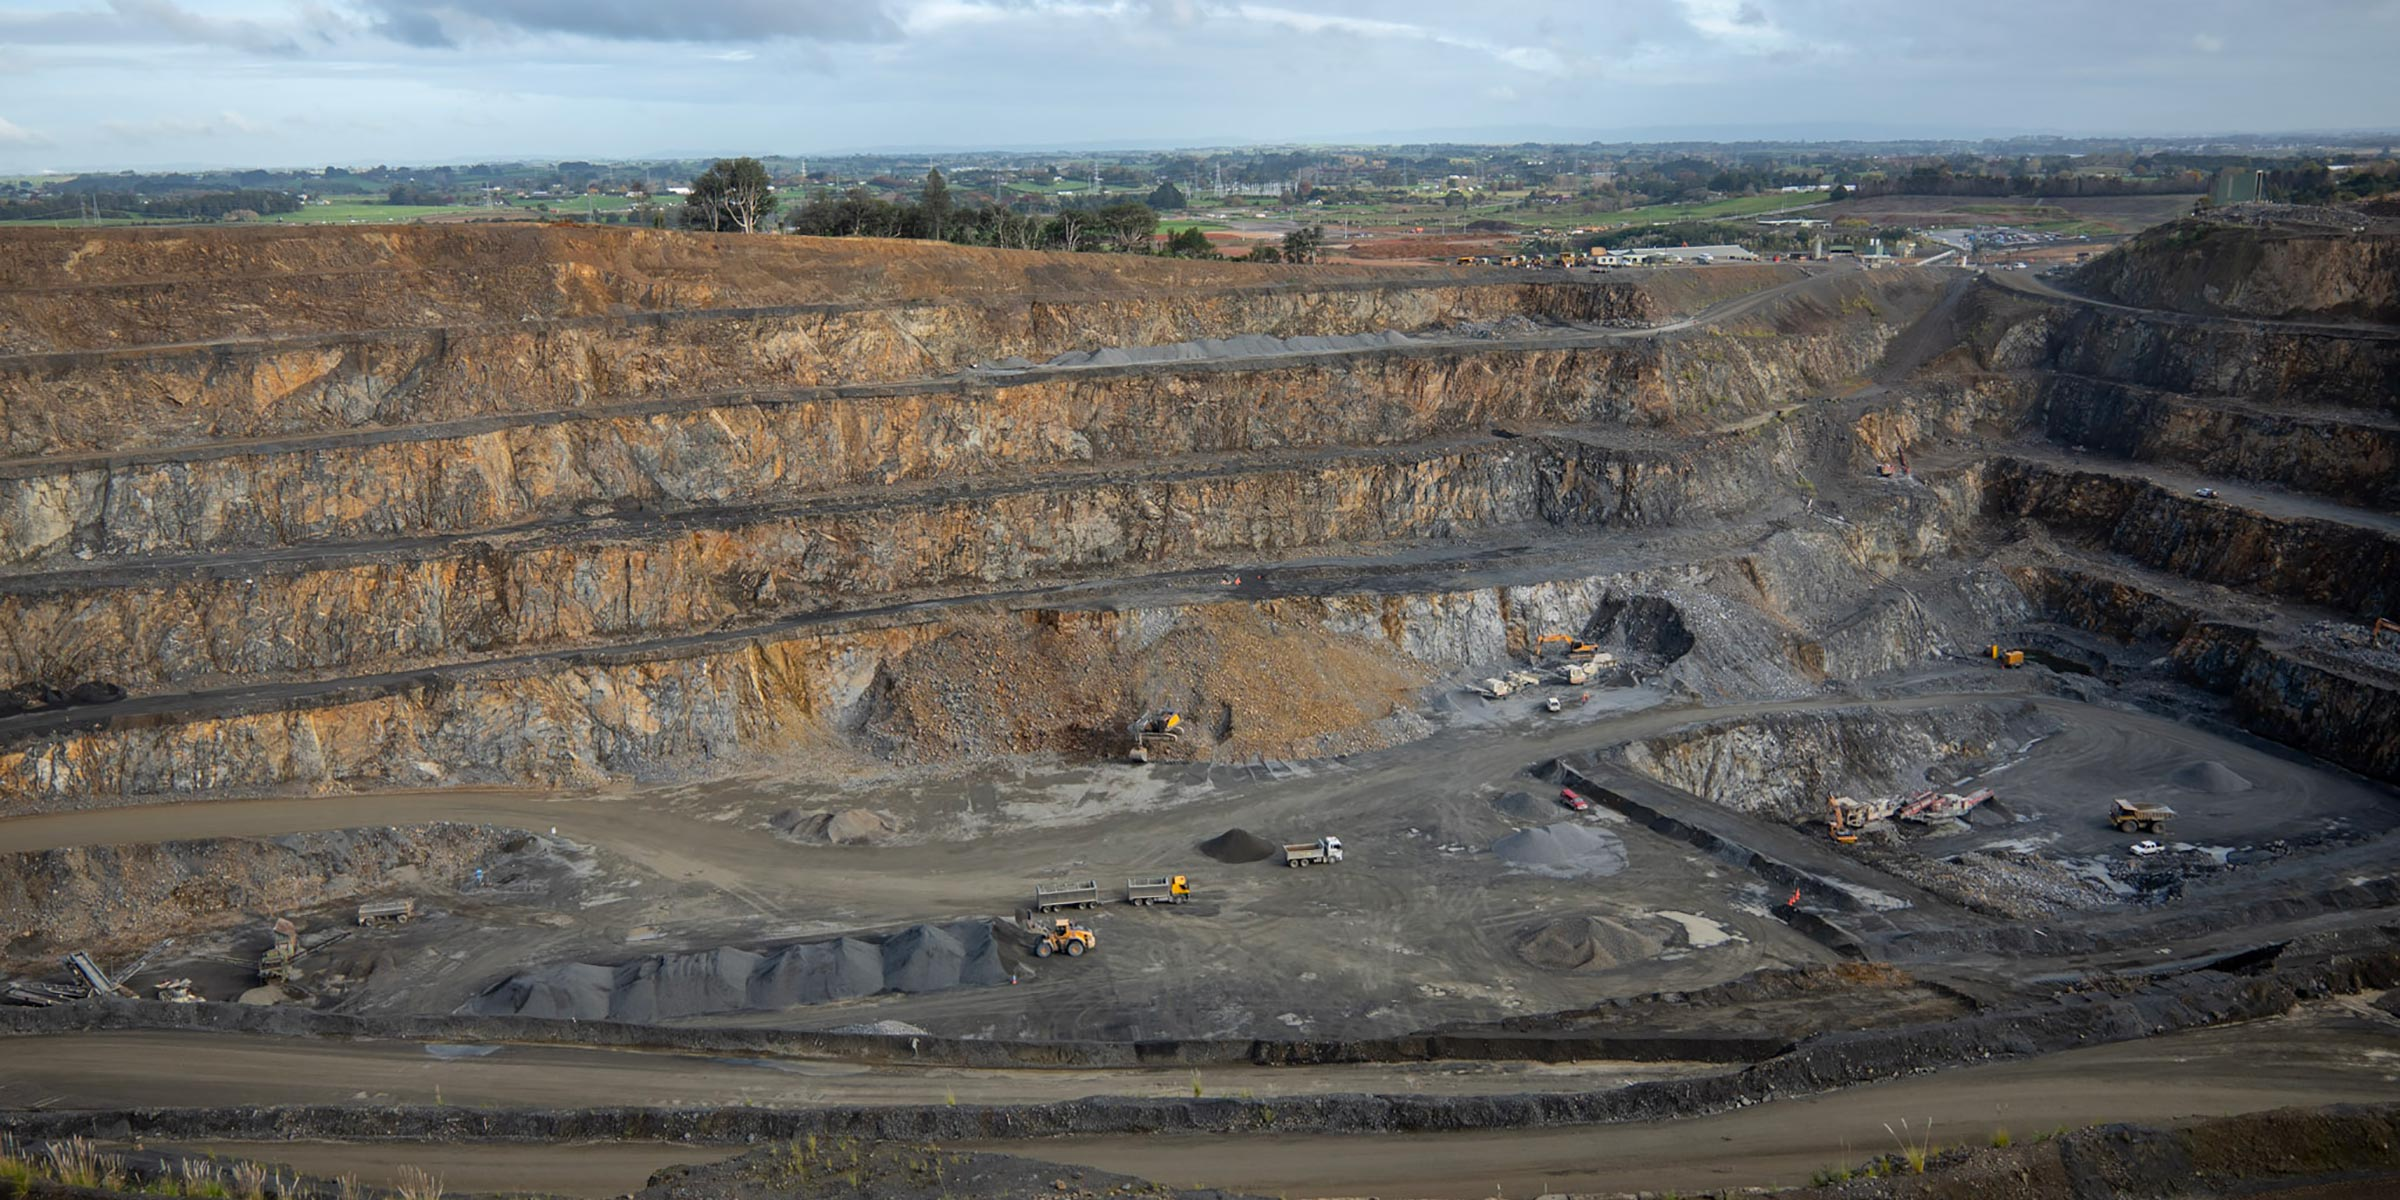
Getting a good understanding of theoretical performance gives the starting point for further analysis. Image: Eltirus
So first, take the time to make sure your data set of actual performance is large enough to give you a true sense of the operation and also check to see if there are any outliers that are screwing with the data – e.g. a haul cycle that took three days etc.
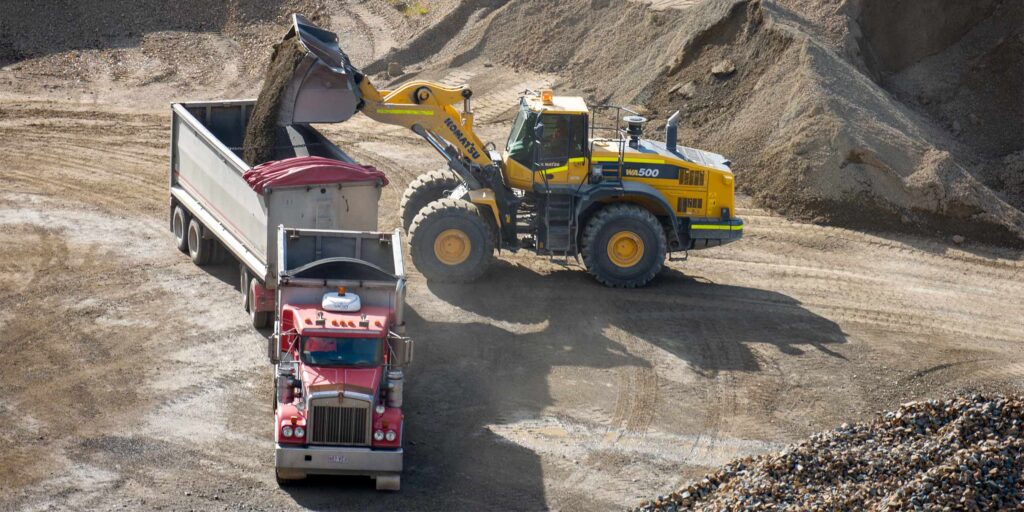
As I noted above, the best data you will get for mobile plant operations is from productivity data systems such as Caterpillar TPMS, VIMS, VisionLink and the like and Komatsu PLM, VHMS, Smart Quarry etc. (apologies to other manufacturers who I know also have similar systems). Specifically, you are going to be interested in things like payload, empty stopped time (waiting for the loading tool), loaded stopped time (waiting at the crusher or haulroad chokepoint), first load time, break times and last load time.
For fixed plant, you want to find run time, belt weigher, stoppage data and any other data you can get. Given that that fixed plant systems are often site specific and may or may not store historical data, this can be more difficult. As noted above more data is better.
Gap analysis
Now the fun starts – why is theoretical different to actual?
This is also the point where the team will generally want to pull apart the theoretical and, in some cases, will assert that it came out the wrong end of the bull (and perhaps you too).
The trick is to approach the analysis with a confidence in your starting point and an open mind about what you see and the data you collect.
Let’s look at a real-world example. The site had a crusher that was name plate capable of twelve hundred (1,200 tph) tonnes per hour. Actual performance over a six-month period (backed up with good data) was that it was actually doing about six hundred (600tph) tonnes per hour.
No-one was questioning this performance (or lack thereof), but it was hurting the site and the prevailing view was that more equipment was needed to meet production (or longer hours).
Remediation
Investigation found that the reason the crusher was run slow was because if the feed hopper was kept full and the apron feeder run at a speed capable of feeding 1200tph, there were frequent jams that could only be fixed by digging out the hopper (a slow and painful exercise). Hence the ‘solution’ was to run the hopper near empty and slow (to keep the weight off the apron feeder).
In this instance, we have the problem of not enough production through the crusher being proposed to be solved by more equipment and work hours.
Instead, investigation was undertaken to find out why the apron feeder jammed and then to fix that problem and get the rate up.
With the mechanical/hydraulic issues relating to the apron feeder fixed, we still couldn’t get better than 1000 tph through the system. Further investigation found that the transfer chute from the crusher to the main belt was too small and choked off the system.
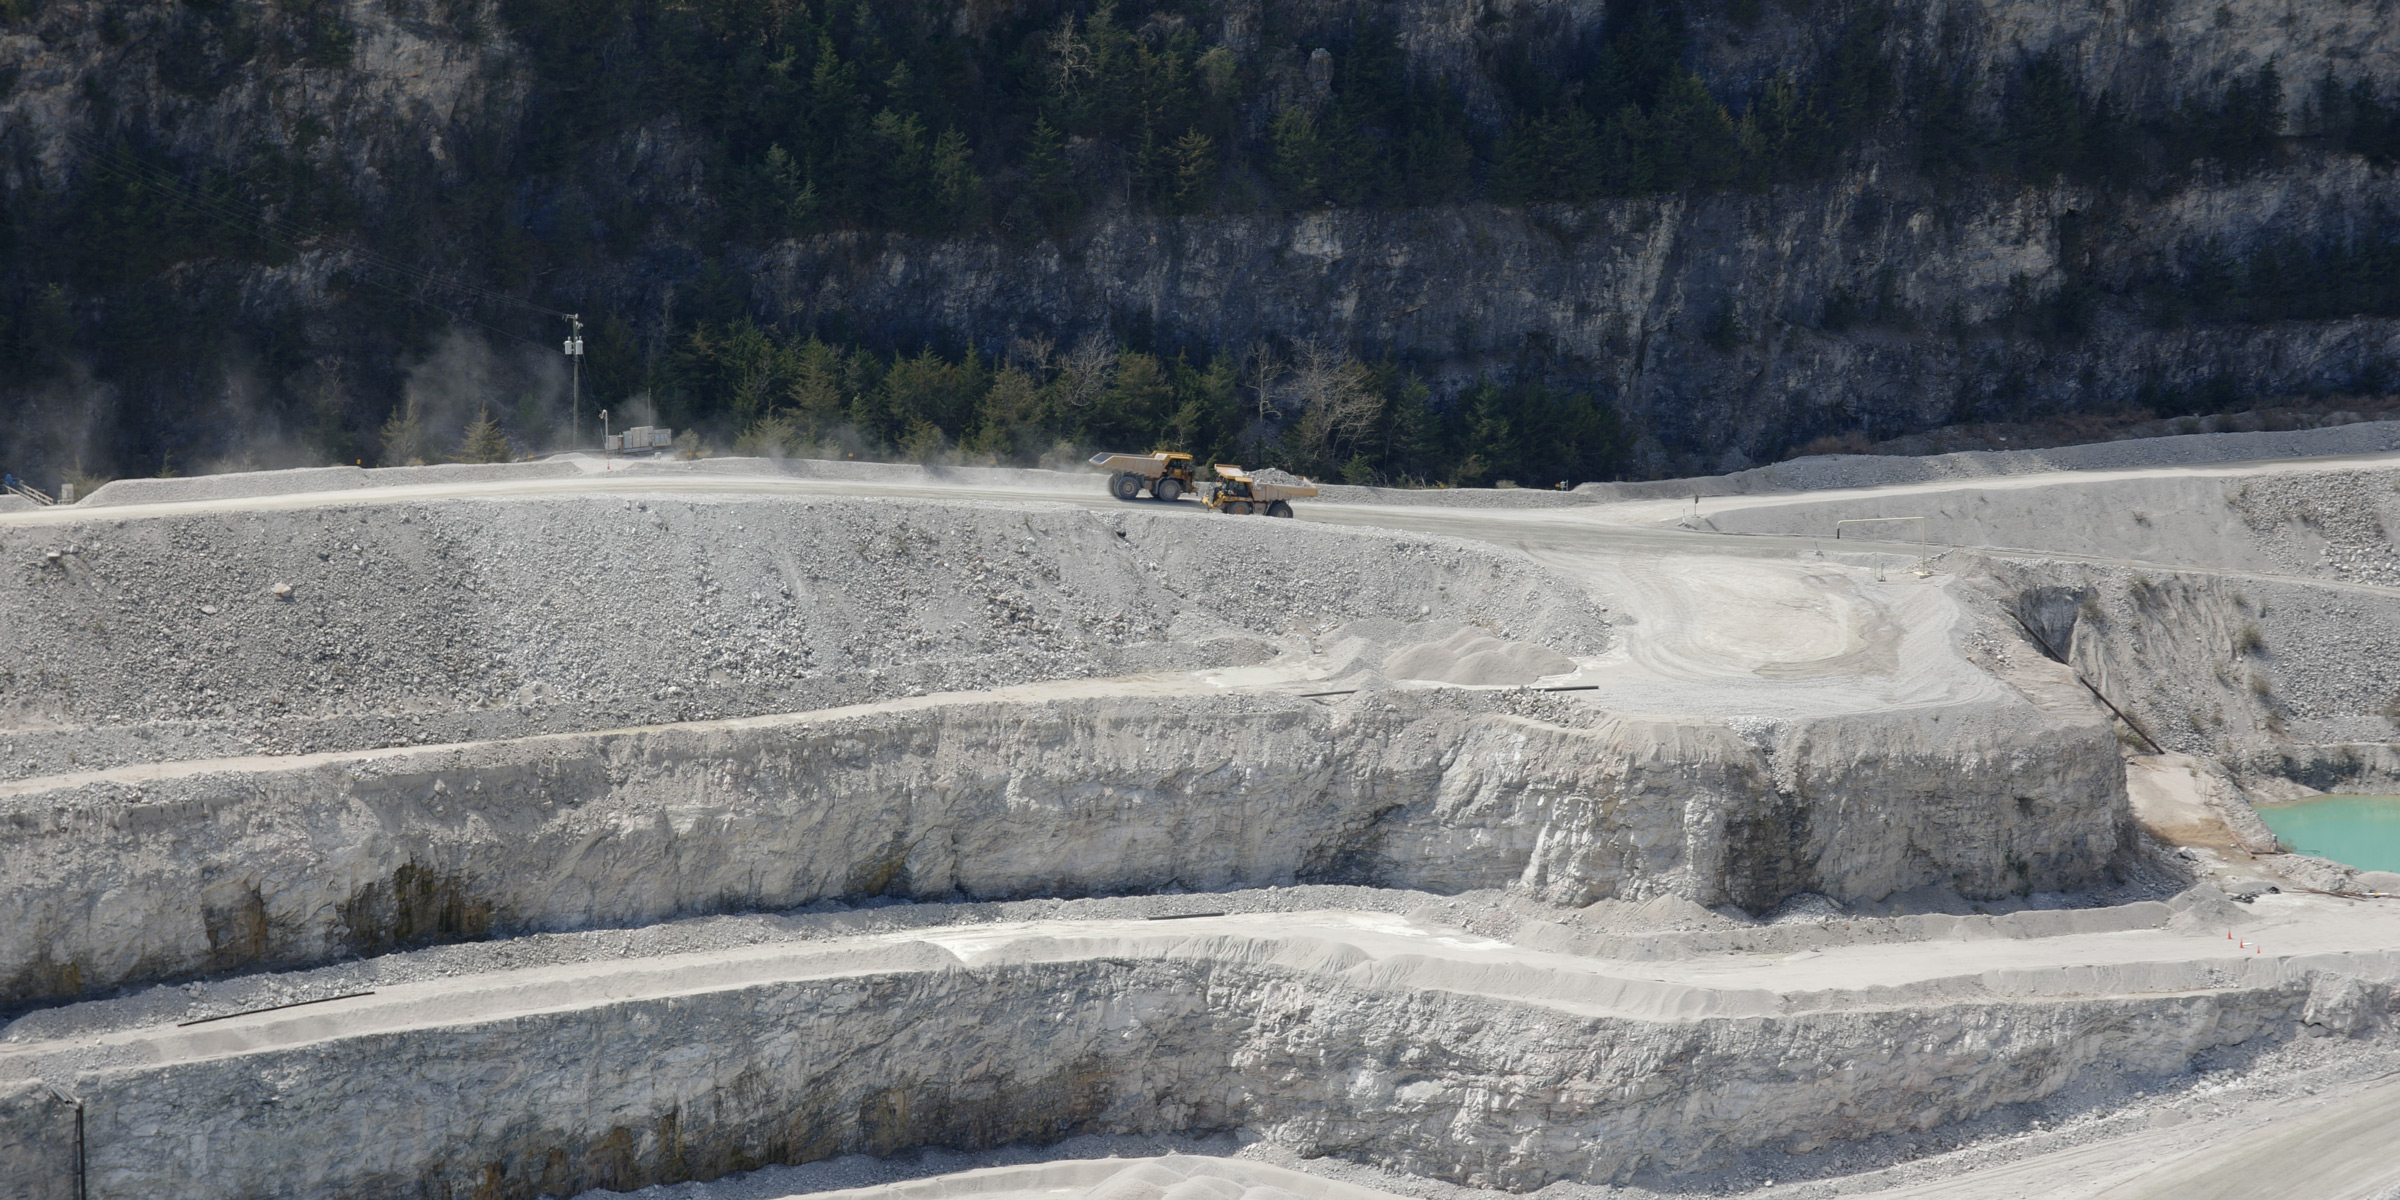
To get the best out of any system, the first thing to do is to analyse the gap between the theoretical vs the actual. Image: Eltirus
This of course led to an engineering study and rectification project to fix this problem too, which then lead us to find yet another bottleneck that needed to be rectified before we could get the production out of the system we expected. Note that this investigation and rectification took quite some time – it certainly wasn’t done in the snap of fingers – there were many months of work.
The key thing I am trying to point out however is that the improvement started with having a theoretical knowledge of what the crusher should be capable of and then being willing to ‘dig in’ and find out why theoretical and actual were different.
As noted above, you might find that there is more than one issue and that a multi-disciplinary approach (mechanical and electrical engineer etc.) is required to get to the bottom of the issues.
Other factors
You will also find that as you fix one issue, you highlight an inefficiency in another. As we pushed production up close to 1000 tph, we ran into periods where we didn’t have the haulage capacity to feed the crusher and so that lead to further studies.
In this instance, the telematics data off the trucks was vital in helping to understand what was happening with the haul fleet. It provided incontrovertible information about the time first and last loads were occurring, loading tool cycle times and time lost waiting at both the crusher (loaded stopped time) and at the loader (empty stopped time).
From this analysis, we then worked on improved supervision of the team and policing waiting time generally. This ensured that we had the team working the maximum number of hours of the shift.
We also found we needed to do some work on improving loading tool performance through operator training and better job access setup.
Lastly, we found that as the material stacker boom angle increased beyond a certain point, we had excessive spillage and had to add a PLC programming mod to back off the feed at a certain point.
Summary
In all instances, a combination of good data and good operational observation can bring remarkable gains. I say ‘operational observation’ because sometimes people simply don’t get out in the field enough (through the pressures of other parts of their job) to see what is really happening there.
My personal view is you will always learn more about what’s happening on a site by walking around it, looking, listening, putting you hand on a gearbox as you walk by (to feel for excessive heat or vibration) and the like than you ever will driving through a site.
If you are looking for improvement in site performance, you might then approach it like this:
- Work out what good looks like
- Make sure your team knows what good looks like to you
- Determine what the true current performance is
- Determine what the gap is
- Communicate the gap and get the crew’s input
- Investigate why the gap exists and work up a plan to close the gap, knowing that it might be multi-part
- Keep on reviewing performance against your standard and look for further opportunity
Once you have gotten everything out of the systems you have, then look to improve them again through the application of capital (new equipment or technologies).
This article originally published on the Quarry Magazine website – click here to view the full original article.
To find out more, contact Steve Franklin on +61 474 183 939 or steve.franklin@eltirus.com